


YouTube Analytics gives creators plenty of numbers. The harder part is deciding which ones matter and what to change after reading them.
A change in click-through rate does not explain an entire video’s performance. More views do not automatically mean stronger audience development. A retention dip tells you something different from a change in traffic sources.
The most useful way to read YouTube Analytics is to connect metrics across the viewer journey, from discovery and clicks to watch behavior, audience development, subscribers, and revenue.
This guide explains which YouTube Studio analytics reports matter, how to interpret them together, and how to turn the findings into practical content decisions.
Key takeaways
- YouTube Analytics works best when related metrics are interpreted together instead of judging one number alone.
- Impressions, click-through rate, views, and watch time describe different stages between discovery and viewing.
- Audience retention helps creators identify where viewers continue watching, rewatch, skip, or leave.
- Traffic-source reports show how viewers discovered content and help explain differences between videos.
- Shorts and long-form videos should be reviewed within their own reporting context rather than compared only by total views.
- For ecommerce brands, YouTube Analytics explains content behavior while Google Analytics can add traffic-source and website or app measurement.
What is YouTube Analytics?
YouTube Analytics is the reporting system inside YouTube Studio for understanding the performance of a channel and its individual videos.
YouTube organizes analytics into areas including Overview, Content, Reach, Engagement, Audience, Revenue, and Research. Some reports work at channel level, others at video level, and Advanced Mode provides expanded comparison and export options.
You can use those reports to investigate questions such as:
- How are viewers finding my content?
- Are people choosing to watch after seeing the thumbnail?
- How long do they watch?
- Where do viewers stop or skip?
- Which content brings subscribers?
- How does performance differ between videos or formats?
- What revenue information is available for eligible channels?
The goal is not to monitor every available number. Start with the decision you need to make, then choose the report that answers that question.
A simple framework is:
Reach shows how content is being discovered.
CTR and views help explain what happens after a thumbnail is shown.
Watch time and retention show what happens after viewing begins.
Audience reports show how the audience develops.
Revenue reports show earnings information for eligible channels.
YouTube also notes that some data, including certain geography and traffic-source information, can be limited.
How do you check YouTube Analytics?
You can check YouTube Analytics in YouTube Studio at either channel level or individual-video level.
For channel-level analytics:
- Sign in to YouTube Studio.
- Select Insights from the left menu. On channels that have not yet received the July 2026 update, this tab is still labelled Analytics.
- Open the report or analytics area relevant to your question.
For a specific video:
- Open Content in YouTube Studio.
- Select the video.
- Open Analytics.
Channel-level reporting helps identify patterns across your content, while video-level reporting lets you investigate what happened with one upload. YouTube documents different report availability at each level.
As of September 2026, YouTube is rolling out an updated Studio experience. The Analytics tab is being renamed Insights, related metrics and charts are grouped into a new layout, and the Trends tab is becoming Research. The underlying data is the same. Eligible creators also see AI insight cards including Channel Summary, Content Patterns, Audience Loyalty, and Video Summary.
Which YouTube Analytics metrics matter most?
The YouTube Analytics metrics that matter most depend on the question you are trying to answer, but impressions, CTR, views, watch time, retention, traffic sources, audience data, subscribers, and revenue cover the main stages of channel analysis.
Use metrics as a diagnostic system rather than one universal scorecard.
Goal | Start with | Read together with | Question to answer |
Reach | Impressions | Traffic sources | Is the content being shown and where is discovery happening? |
Viewer choice | Impressions CTR | Impressions, views, watch time | What happens after people see the thumbnail? |
Viewing behavior | Watch time | Average view duration, retention | Where does attention hold or fall? |
Audience development | New, casual and regular viewers | Subscribers | Is the audience developing beyond one-off discovery? |
Discovery | Traffic sources | CTR, watch time | Where are viewers finding the content? |
Shorts | Shorts reports | Views, likes, subscribers, discovery source | Which short-form patterns repeat? |
Revenue | Revenue reports | Content and audience performance | Which videos are associated with monetized performance? |
Ecommerce | Website traffic source | Configured website/app measurement | What happens after people leave YouTube for an owned property? |
The framework prevents one of the easiest analytics mistakes: treating a single metric as a complete explanation.
What do impressions and click-through rate mean in YouTube Analytics?
Impressions show how often eligible thumbnails were displayed on YouTube, while impressions click-through rate shows how often viewers watched after seeing one of those thumbnails.
YouTube’s “Impressions and how they led to watch time” report connects thumbnail impressions with resulting views and watch time. The report may also show what share of impressions came from YouTube recommending the video.
Think of the relationship as:
Impressions → CTR → views → watch time
If impressions grow but resulting views do not move at the same rate, examine what happens between thumbnail exposure and viewing.
If views increase but watch time or retention is weak, move beyond the thumbnail and investigate the viewing experience.
Not every view starts from a counted thumbnail impression.
YouTube counts an impression when a thumbnail is visible for more than one second and at least 50% of it appears on screen. Counted surfaces include YouTube Search, the homepage, feeds, playlists, and Up Next recommendations. External sites and apps, email, notifications, YouTube Music, and several other surfaces do not count toward this impressions metric.
That is why total views and thumbnail impressions should not be expected to match one-for-one.
Why do my YouTube videos get impressions but no views?
Imagine a video receives:
- 100,000 eligible thumbnail impressions
- 5,000 resulting views
- a noticeable decline during the opening minute
Do not stop at the view total.
First look at how impressions translated into views. Then open audience retention to see what happened after viewers started watching.
If viewers leave near the beginning, the useful investigation shifts from discovery to the opening content and whether it delivers on the expectation created before the click.
How do you read audience-retention reports?
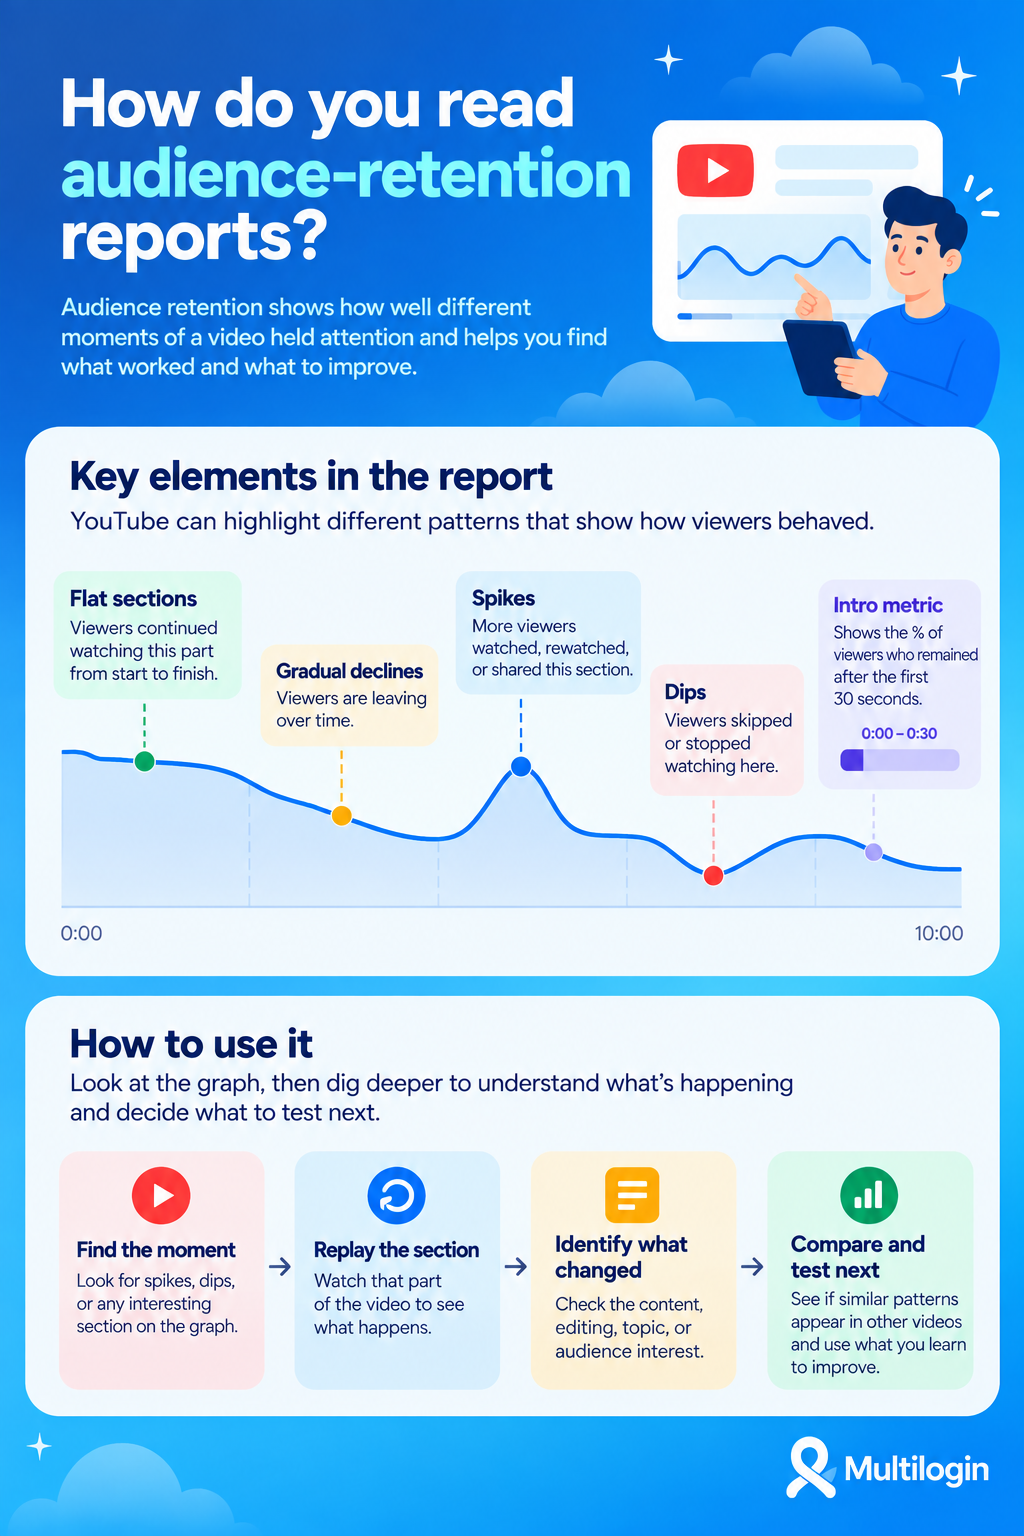
Audience retention shows how well different moments of a video held attention and identifies sections where viewers continued watching, rewatched, skipped, or left.
The report is available at video level. YouTube can highlight flat sections, gradual declines, spikes, dips, intros, and top moments.
YouTube describes the main patterns this way:
- Flat sections mean viewers continued watching that part from start to finish.
- Gradual declines indicate viewers leaving over time.
- Spikes appear where more viewers watched, rewatched, or shared a section.
- Dips show places viewers skipped or stopped watching.
The intro metric shows what percentage of viewers remained after the first 30 seconds. YouTube says a stronger intro percentage can indicate that the opening matched the expectation set by the title and thumbnail and kept viewers interested.
Context matters.
A spike may reflect a useful moment people wanted to replay, but YouTube also notes that viewers can rewatch because something was unclear. A dip deserves review, but the graph alone does not explain why viewers left.
A practical process is:
Find the moment → replay the section → identify what changed → compare similar videos → decide what to test next.
Which metrics help you improve watch time decisions?
Watch time decisions should start with watch time, average view duration, and audience retention rather than total views alone.
YouTube defines watch time as the amount of time viewers have watched a video. Average view duration reports the average minutes watched among viewers who stayed to watch.
Retention adds the location of that behavior.
If viewers leave early, inspect:
- whether the opening matches the title and thumbnail
- whether the main idea takes too long to arrive
- whether viewers repeatedly skip a section
- whether a later part produces a top moment or spike
YouTube specifically suggests considering whether compelling material that appears later could be introduced earlier.
The objective is not simply to make videos longer. It is to understand which sections keep attention and which sections do not.
How can YouTube Analytics help grow subscribers?
YouTube Analytics can help with subscriber strategy by showing which content generates subscribers and how the broader audience develops over time.
The Content report can show subscriber gains by content type, including videos, Shorts, live streams, and posts.
The Audience area also reports monthly audience and classifies viewers as new, casual, or regular based on their viewing history with the channel.
These reports answer different questions.
Acquisition: Which content attracts viewers and subscribers?
Audience development: Are viewers moving beyond first-time discovery into repeated channel viewing?
A single video may bring many first-time viewers without producing the same pattern on later uploads. Another topic may attract fewer initial viewers but appear repeatedly among content watched by a more established audience.
Reviewing subscriber gains alongside audience development gives more context than subscriber totals alone.
How should traffic sources guide your YouTube content strategy?
Traffic-source reports show where viewers discovered your content, which helps explain why different videos attract different viewing patterns.
YouTube’s Content reports show discovery sources such as browse features, Shorts feed, suggested videos, YouTube Search, channel pages, external sources, and others depending on the format.
Advanced Mode also supports traffic-source breakdowns.
Use this data to ask:
- Which topics repeatedly attract YouTube Search traffic?
- Which videos are discovered through browse or suggested surfaces?
- Which content receives meaningful external traffic?
- Do different discovery sources lead to different viewing behavior?
- Does the same discovery pattern appear across several similar videos?
Do not assume every successful video should have the same traffic-source mix.
The useful goal is to understand how viewers found the content and what happened after they arrived.
How should you analyze YouTube Shorts?
YouTube Shorts should be analyzed within Shorts-specific reports rather than judged only against long-form video totals.
YouTube separates Shorts from videos and live content in the Content area. Shorts reporting includes views, likes, subscribers, how viewers found the Shorts, and a report showing how often viewers stayed to watch past the initial seconds.
For Shorts, examine:
- views
- likes
- subscriber gains
- discovery sources
- whether viewers stayed to watch
- patterns across similar Shorts
Compare Shorts primarily with other Shorts over similar periods.
A Short and a long-form tutorial can serve different viewing behaviors. A larger raw view count does not by itself establish that one format contributes more to every channel goal.
Which YouTube Analytics reports matter for monetization?
For creators in the YouTube Partner Program, the Revenue tab is the main native YouTube Analytics area for reviewing channel or video earnings data.
YouTube says eligible creators can access Revenue reporting at both channel and video level, and the key metrics card includes estimated revenue.
Revenue data becomes more useful when read beside content and audience reports.
Ask:
- Which videos are associated with the revenue change?
- How did those videos perform for watch time and retention?
- How were viewers discovering them?
- Was the change concentrated in one upload or repeated across several?
How can ecommerce brands measure YouTube conversions?
Ecommerce brands can use YouTube Analytics to understand content performance and Google Analytics to add website or app traffic-source measurement after users leave YouTube.
YouTube Analytics answers questions about discovery and viewing behavior.
Google Analytics can process campaign parameters and traffic-source fields such as source, medium, and campaign into reporting dimensions. That allows a brand to build a measurement path such as:
YouTube content → referred or campaign-tagged visit → website/app behavior
If the site or app is configured to measure important actions, the team can then analyze those actions alongside the acquisition source.
Keep the two systems conceptually separate.
YouTube Studio explains what happened with the content on YouTube. Google Analytics helps analyze what happened on the measured website or app after traffic arrived.
Do not assume the video with the most views must also produce the strongest downstream business result.
How do you compare YouTube videos without misreading the data?
Compare YouTube videos using similar formats, appropriate time periods, and consistent metrics instead of relying on raw lifetime totals.
Advanced Mode lets creators:
- compare videos, groups, or time periods
- change date ranges
- add or remove metrics
- break reports down by dimensions such as content, traffic source, or geography
- apply filters
- save reports
- export the current view
- switch between daily, weekly, monthly, and yearly views
This helps avoid misleading comparisons.
A video published months ago has had more time to accumulate views than a recent upload. Shorts and long-form videos have different reporting contexts. Search-discovered content may also behave differently from content found through browse or suggested surfaces.
When the comparison is fair, which pattern repeats?
Imagine an ecommerce brand publishes:
- short product-tip videos
- longer buying guides
The Shorts receive more views, while the buying guides produce longer viewing sessions and more website visits in the brand’s measured traffic data.
That does not prove one format is universally better.
The data may instead suggest that the two formats serve different jobs. The team can evaluate Shorts against short-form discovery goals and buying guides against deeper viewing or website behavior.
The metric should follow the goal.
How often should you check YouTube Analytics?
Review YouTube Analytics on a consistent schedule that gives the relevant reports enough time to develop instead of reacting to every early fluctuation.
Not all reports are immediate.
YouTube says audience-retention data typically takes one to two days to process.
A practical process is to make a quick check after publishing for obvious issues, then return for a structured review after the reports needed for your decision have populated.
For an actively publishing channel, a weekly review is a useful editorial routine rather than a platform-defined requirement.
Consistency matters more than repeatedly reopening the dashboard without a question to answer.
What is the best weekly YouTube analytics workflow?
The best weekly YouTube Analytics workflow moves in one direction through the viewer journey: check overall channel direction, then discovery, then packaging, then retention, then audience development, then compare similar content, and finish with one clear next test.
1. Review overall channel direction
Start with the Overview and Content reports.
Ask:
- Which content contributed most to the week’s changes?
- Is the movement concentrated in one upload?
- Do similar videos show the same pattern?
- Which content format is contributing?
Do not turn one unusual upload into a channel-wide conclusion.
2. Check discovery
Review impressions and traffic sources.
Ask:
- Are eligible thumbnails being shown more or less often?
- Where are viewers finding the content?
- Did the discovery mix change compared with similar videos?
3. Review packaging
Read impressions together with CTR, views, and watch time.
Avoid stopping at “CTR increased” or “CTR decreased.”
Ask what happened across the path from thumbnail exposure to viewing.
4. Inspect retention
Open audience retention for important recent videos.
Check:
- the first 30 seconds
- meaningful dips
- spikes
- top moments
- recurring patterns
Then replay those parts of the video.
The graph identifies where the behavior happened. Reviewing the content helps you form a reason to test.
5. Review audience development
Check new, casual, and regular viewer reporting where available, together with subscriber changes.
Ask whether successful content mainly attracts first-time viewers or appears to support repeat channel viewing.
6. Compare similar content
Use Advanced Mode to compare appropriate videos, groups, periods, metrics, or traffic sources. Compare like with like whenever possible.
7. Choose one next test
End with one specific decision.
For example:
- test a clearer opening
- introduce a strong section earlier
- create another video around a repeated audience interest
- test different packaging for a recurring topic
- investigate a traffic source that repeatedly brings engaged viewers
Analytics becomes useful when it changes the next decision.
What are the most effective ways to use YouTube Analytics?
The most effective ways to use YouTube Analytics are to read related metrics together rather than alone, compare only similar content and time periods, inspect the moments where retention changes, confirm a finding repeats before acting on it, and end every review with one specific test. Each of these turns a report into a decision. The list below applies them in the order a review usually runs.
1. Compare connected metrics
Read impressions with CTR, views, watch time, and retention instead of optimizing one number in isolation.
2. Segment similar content
Compare Shorts with Shorts and comparable long-form videos with one another so format differences do not distort the conclusion.
3. Inspect retention moments
Replay the video around meaningful dips, spikes, and top moments to understand what viewers were seeing at those points.
4. Track repeated patterns
Look for findings that appear across several videos or periods before treating one result as a channel-wide rule.
5. Record one next action
Finish each analytics review with one specific content question or test so the next upload gives you something meaningful to compare.
How should teams organize analytics work across multiple YouTube channels?
Teams running several YouTube brand or client channels can keep analytics work organized by giving each channel its own separate environment, so sessions and logins do not overlap.
The practical problem is not the data. It is the access layer. Checking five client channels in one browser means repeated logging in and out, mixed Google sessions, and a real risk of pulling a report for the wrong channel.
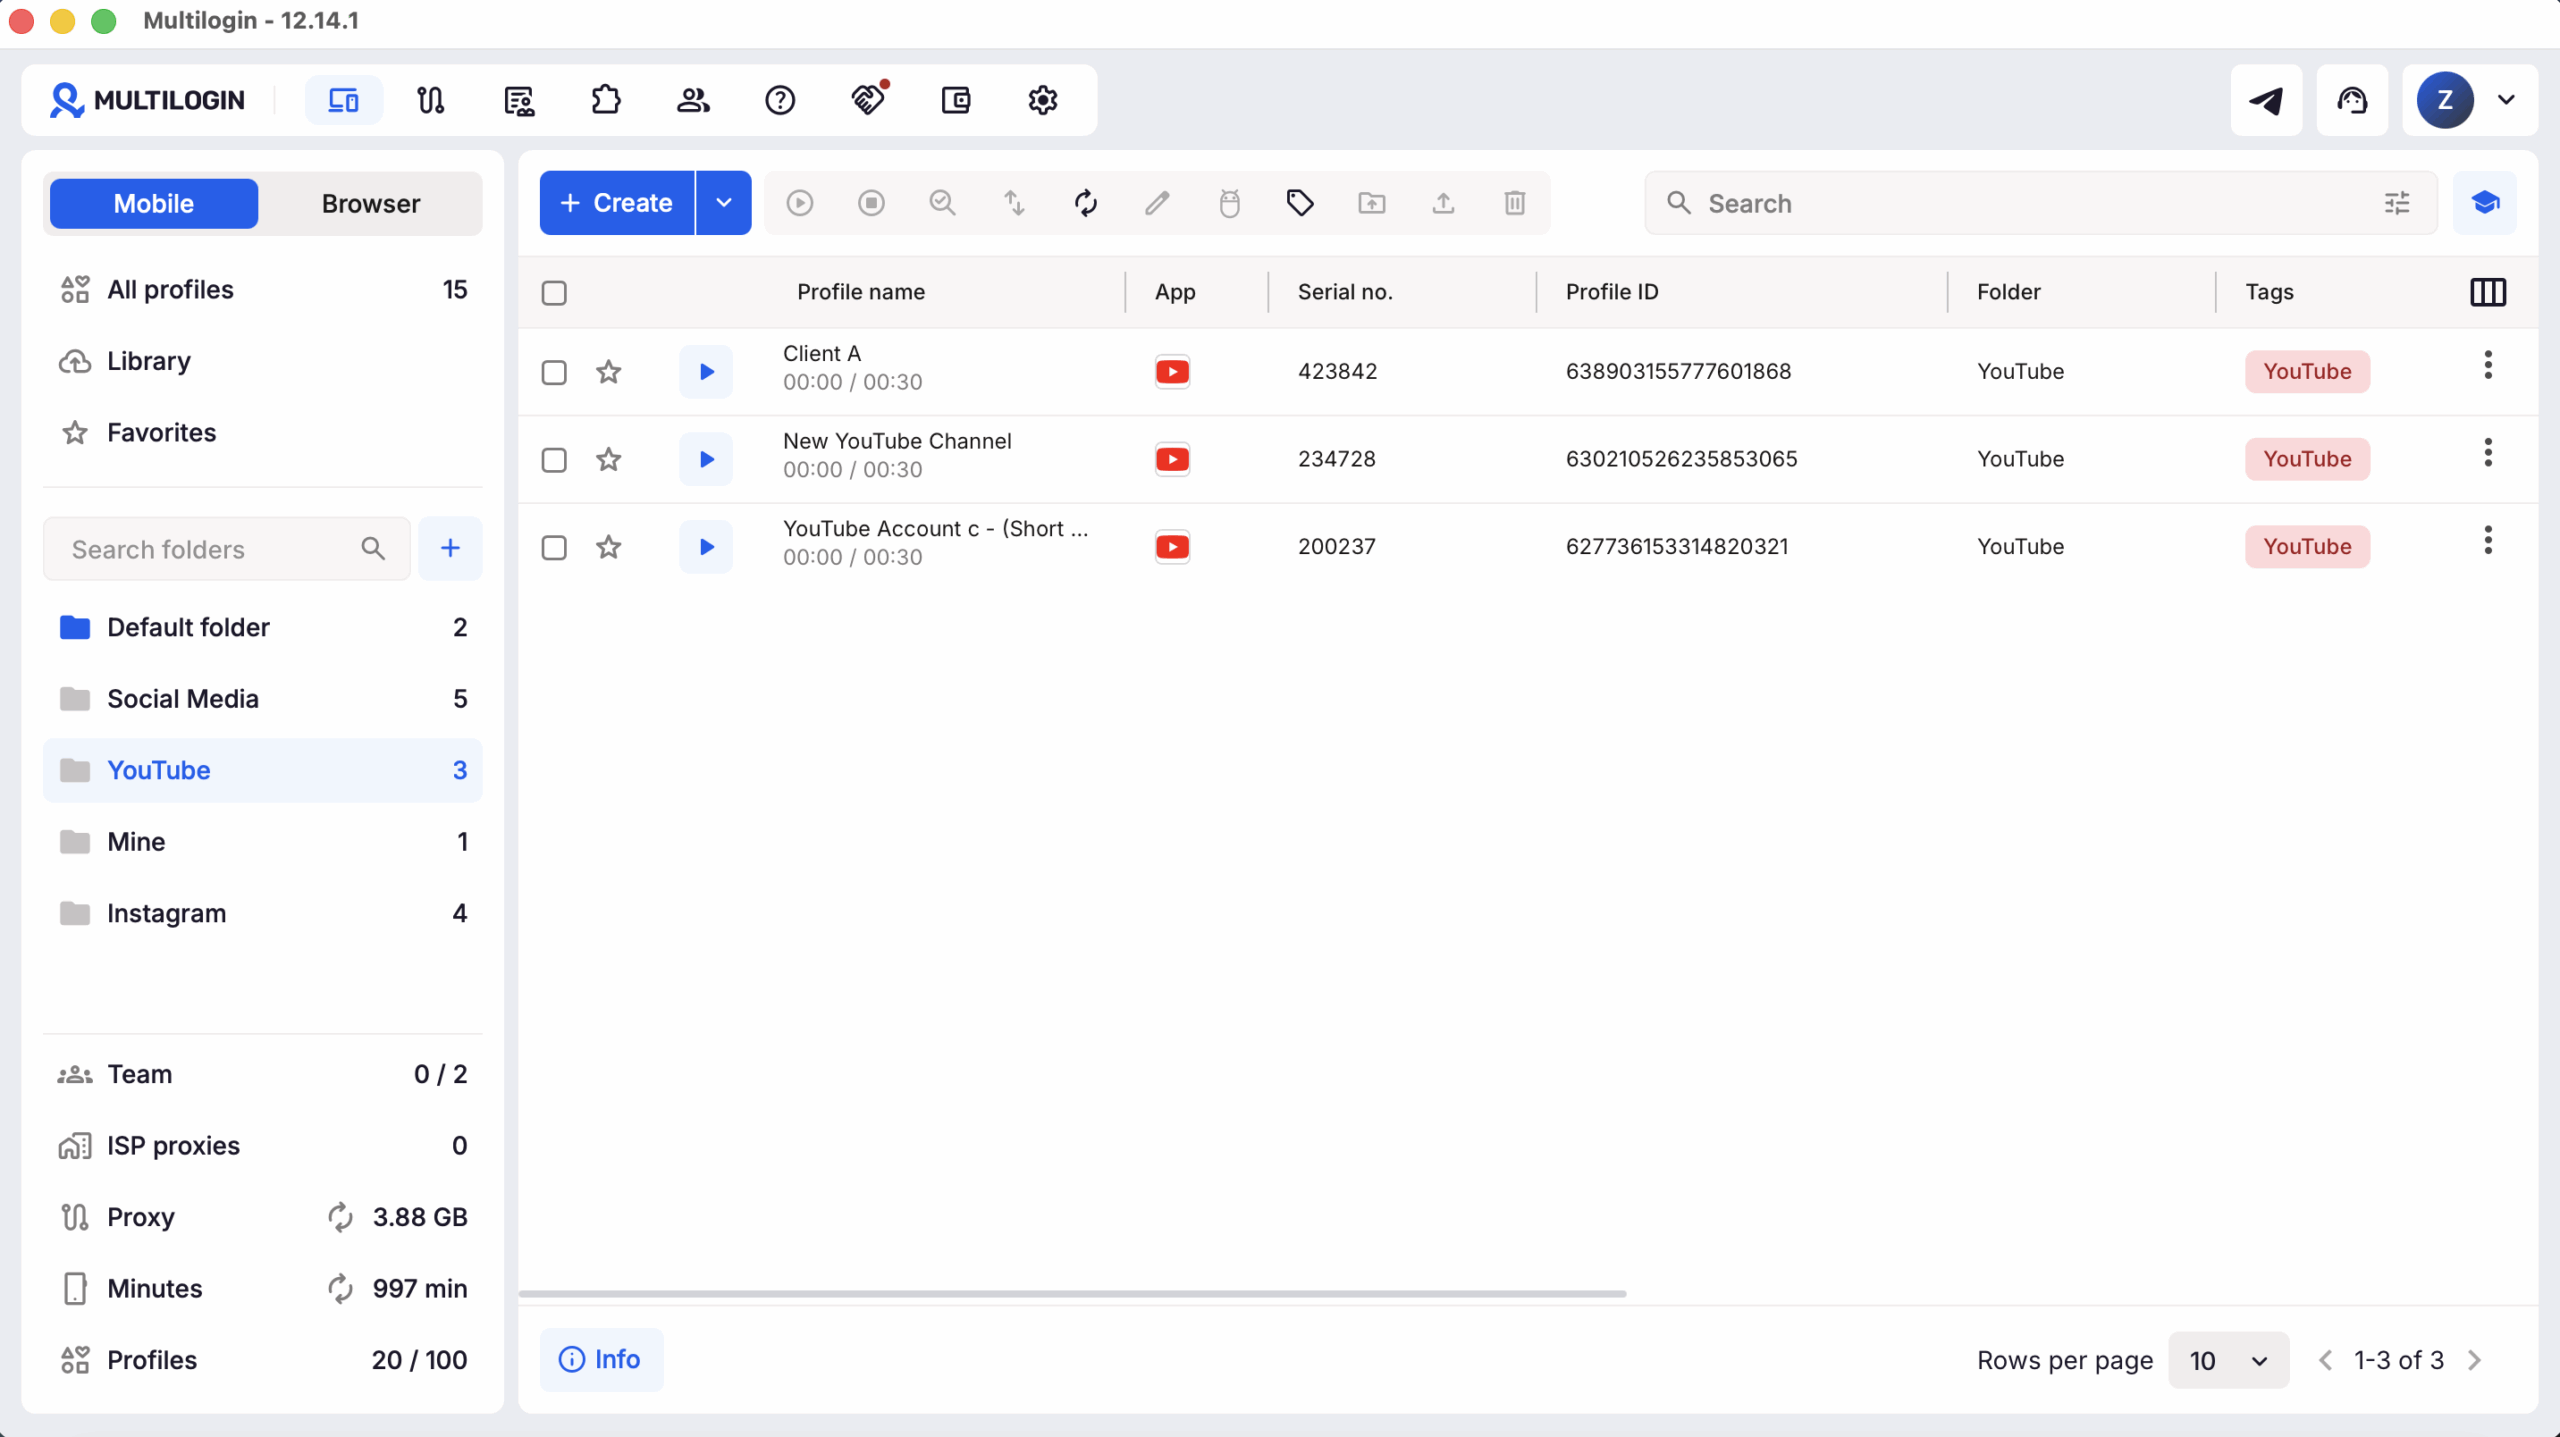
Multilogin is a cloud phone platform for social media marketing that includes browser profiles for web-based account work.
For YouTube Studio analytics, use browser profiles. Studio is a web workflow, so it belongs in a browser profile rather than a cloud phone. Each browser profile keeps its own cookies, session data, fingerprint, and proxy settings, and Multilogin’s documentation names YouTube web as a browser-profile workflow. One profile per channel means the Google session for that channel stays inside it.
For the YouTube mobile app, use an Android cloud phone. When a workflow has to happen in the app rather than in Studio, an Android cloud phone is the right environment. The same documentation sets the rule: browser for web work, cloud phone for mobile-app work.
A workable setup for an agency looks like this:
- one browser profile per client channel, named for the client
- the profile’s proxy location matched to the audience or team location for that channel
- team permissions set so an account manager opens only the channels assigned to them
- the cloud phone reserved for the channels that genuinely need app access
Be clear about what this does. The separation is operational. It keeps daily account work organized and reduces login mistakes. It does not create views, improve retention, increase recommendations, or change monetization. It is also not a way around platform rules. The reliable approach combines clean account separation with original content, real engagement, and platform-compliant activity.
If you manage more than a handful of client channels, start on the free plan and set up one browser profile per channel before your next weekly review.
Final thoughts
YouTube Analytics works best as a decision system rather than a scoreboard.
Start with the question you need to answer. Then select the metrics that describe that part of the viewer journey.
Use impressions and traffic sources to understand discovery. Use CTR to understand what happens after eligible thumbnail exposure. Use watch time and retention to examine the viewing experience. Use audience reports to understand how the audience develops. Use Revenue reporting when monetization is the question, and connect website or app measurement when the business goal continues beyond YouTube.
Then compare the pattern over time.
One metric tells you part of what happened. Connected reports give you a better basis for deciding what to test next.